Muriel Medard said that the IT Society is only 1% of the IEEE. All you other Electrical Engineers : you are the 99%!
ETA : Only 0.1% become Fellows! We are the 99.9%!
Muriel Medard said that the IT Society is only 1% of the IEEE. All you other Electrical Engineers : you are the 99%!
ETA : Only 0.1% become Fellows! We are the 99.9%!
We are at ISIT and I realize I am going over the same points multiple times with my students, so I thought of summarizing everything here.
How to give a better ISIT Talk.
1. Take your talks very seriously.
Do practice runs. Many of them. Your only hope for academia is by giving great talks. Give a practice talk to your friends. In the middle of your talk pause and quiz them: ok, did you get why alpha and beta are not independent? (hint: they did not).
If they did not, it is your problem not their problem.
2. They do not remember what alpha is.
In most talks, your audience does not understand what the notation is, what the problem is, or why they should care. Think of yourself: how often do you sleep or suffer through talks without even knowing what the problem is?
Do not treat your audience like that.
It is a typical scene when the presenter is focusing on a minor technical issue for ten minutes when 90% of the audience does not even know what exactly the problem is, or care.
One important exception is when your audience works on the same problem. Typically only a small part of your talk should be focused on these experts (see also 13).
3. Do a multi-resolution talk.
A useful guideline is: for an 18 minute talk, 7-9 minutes should go on explaining the formulation of your problem and why should anybody care. 5-6 minutes on explaining *what* the solution is and 4 minutes or so, on the actual painful technical stuff. The first part should be aimed at a first year grad student level. The second at a senior grad student in the general ISIT area and the last part to the expert working on related problems. If fewer than 90% of your audience are checking email in the last part of your talk, consider that a success.
4. Try to make things simple, not difficult.
It is a common mistake for starting grad students to think that their work is too simple. For that reason they will not mention known things (like explaining that ML decoding for the erasure channel consists of solving linear equations, because they fear this is too simple and well known).
Always mention the basic foundations while you try to explain something non-trivial. Your goal is not to sound smart but rather to have your audience walk out knowing something more.
Even when your audience hears things they already know, they get a warm fuzzy feeling, they do not think you are dumb.
5. Add redundancy, repeat a lot in words.
Do not say ‘We try to minimize d(k)’.
Say `we try to minimize the degree d which as I mentioned, is a function of the number of symbols k’. Repeat things all the time: Summarize what you will talk about, and in conclusions say the main points again.
6. Go back to basic concepts in words, repeat definitions.
Try to mention the basic mathematical components not the jargon you have introduced. Do not not say ‘Therefore, the code is MSR-optimal‘ but ‘Therefore, the code minimizes the repair communication (what we call MSR optimal)‘. Try to reduce your statements back to fundamental things like probabilities, graphs, rank of matrices, etc whenever possible. Do not just define some alpha jargon in the first slide and talk about that damn alpha throughout your talk.
7. Never go over time.
I have often seen even experienced speakers getting a warning that they have 3 minutes and still trying to go through their ten last slides. When you are running out of time, the goal is not to talk faster.
Say something like ‘Unfortunately or fortunately for you, I do not have time to go into the proof so I will have to skip it. The main ingredient involves analyzing random matchings which is done through Hall’s theorem and union bounds. Please talk to me offline if you are interested…”
Then, go through your conclusions slowly, repeating your main points.
This is another example of multi-resolution: you explain the techniques at a high level first. Even if you had time, you would still first have to give a one sentence high level description and then get into the the details.
8. Draw attention to important slides.
People are probably checking the Euro final when you are at slide 4, explaining what your problem is all about. Wake them up and give a notification that this is the one slide they do not want to miss. Do this right before the critical points.
9. Every slide should have one simple message.
After you make your slides ask yourself: what is the goal of this slide, I just want to explain this part. Iteratively try to simplify your slides into smaller and smaller messages. It is easier for your audience to grasp one packet of information at a time. Do not have derivations on slides (especially for an 18 minute talk), unless there is one very simple trick you really want to show. Showing math does not make you look smarter.
10. Be minimalist.
Every word on your slides, every symbol or equation you put up there dilutes the attention of your audience. Look at each bullet/slide and ask, do I really need this part or can I remove it?
11. Be excited.
Vary the tone of your voice, it may wake up somebody. You need to entertain and perform. Think: if you are not excited with your results why should anybody else be?
12. Cite people.
When somebody has related prior work, cite them on your slide. That has the benefit of waking them up when they see or hear their name.
As Rota says: `Everyone in the audience has come to listen to your lecture with the secret hope of hearing their work mentioned.‘
13. Connect to what your audience cares about.
This is non-trivial and requires experience. If you are giving a talk in a fountain codes session, you do not have to spend ten minutes defining things your audience knows already. Still define it quickly to make sure everybody is on the same page on notation. Knowing how to be at the right resolution for your audience becomes easier in time.
14. Prepare your logistics.
Know the room (go there before), know who your session chair is, have your macbook projector dongle, pre-load your slides on a USB. Bring your charger, disconnect from the internet (fun Skype messages pop-up during talks). If you are using a different machine, test your Powerpoint slides (hint: they look completely different).
15. Talk to people afterwards.
Talk to people about their work and your work. Remember that this is a professional networking event. Do not hang out with your friends, you have plenty of time for that after you go back home. Networking with other students and faculty is very important, in my case I learn more by talking to people offline than in talks.
16. Engineering theory is essentially story-telling.
Our papers and talks are essentially story-telling: Here is a model for a wireless channel, here is a proof about this model. A good story has an intellectual message that will hopefully help people think about a real engineering problem in a cleaner way.
The other aspect of our job is creating algorithms that are hopefully useful in real systems. Think: what is your story and how will you present it in your talk.
17. Read the brilliant Ten Lessons I Wish I Had Been Taught by Gian-Carlo Rota.
I didn’t do such a great job of taking notes this time, but I went to a number of talks today. Maybe Max will blog too.
I am at MIT for ISIT 2012. All of the sessions are in the the student center (W20) and in Kresge, so I am having serious flashbacks to my days of doing theater as an undergrad. Also some vague flashbacks to sneaking into sessions at ISIT 1998. I think I saw Jack Wolf give a great talk on group testing in W20-407 back then.
The program feels pretty packed this year – 9 parallel sessions! I will blog about some of the talks, but as usual I may not be super timely. Perhaps there is a Twitter hashtag for ISIT, but honestly, how many information theorists use Twitter?
If you’re attending ISIT then you probably got an email about Trailhead, a graphical system which links papers at ISIT “based on how many authors they have in common in the references, and each paper is linked to the 4 closest neighbors.” It’s written by Jonas Arnfred, a student at EPFL. The search feature doesn’t seem to be working, but it’s a fun little app.
I wonder how different the graph would look using something like the Toronto Paper Matching System, which is used by NIPS and ICML to match papers to reviewers. One could even imagine a profiler which would help you pick out papers which would be interesting to you — you could upload 10 papers of your own or that you find interesting, and it could re-visualize the conference through that viewpoint.
I was interested in the 19 papers which had no connections. Here are a few, randomly sampled:
 -Additive Self-Dual Codes Preserving Their Properties
They seem to run the gamut, topic wise, but I think one would be hard-pressed to find many unlinked multi-user information theory papers.
On the other side, there’s a little cluster of quantum information theory papers which all have similar citations, unsurprisingly. They show up as a little clique-ish thing on the bottom right in my rendering (it may be random).
Who are my neighbors in the graph?
Karthik Chandrasekaran gave a talk at TTI today on the feasibility of integer programs. Given a polytope defined by the inequalities 

The first thing to figure out is what do we mean by a random instance? Consider a point 


If the radius 
The simple form of the main result is that if 
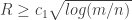
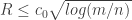


To prove these bounds on
On Saturday I attended the Electronic Data Methods (EDM) Forum Symposium in Orlando. The focus of the workshop was how to build infrastructure for sharing clinical data for improving patient care. This comes in two flavors : quality improvement (QI), which refers to learning from clinical data much like a feedback loop, patient-centered outcomes research (PCOR) or comparative effectiveness research (CER), which is looks at how patient outcomes vary across different treatments. There’s a lot of hope that moving to electronic health records (EHRs) can facilitate these kind of studies, but the upshot of the workshop was that there are a lot of practical impediments.
One big issue that came up was essentially how EHRs are used, and how the data in them is hard to get out in a consistent and quantifiable way. Physicians record results in idiosyncratic ways, and in order to get practicing physicians to buy-in, the data format of EHRs is rather flexible, resulting in huge headaches for people trying to extract a data table out of a databased of EHRs. Much of the data is in running text — NLP approaches are improving, but it’s far from automated.
Once the data is extracted, it turns out it’s quite noisy, and poorly validated. Sometimes it’s a case of garbage-in : the data was not recorded properly in the first place. Other times, it’s due to miscalibration. There were a number of talks (which I missed) dedicated to this. Then there are questions of whether the data you have collected is representative. If you are trying to draw inferences across multiple sites, how do we appropriately account for confounding factors such as demographic differences? This is the kind of thing that can plague even a single-site observational study, butit becomes particularly acute for multi-site investigations.
Finally, even if each site can extract a more-or-less clean data set, you have the problem of sharing this data. This raises headaches from a policy perspective as well as technological perspective. On the policy side, each site has its own IRB and own review, and many instituions are hesitant to cede authority to third party or federated IRBs. For a small number of sites, a policy and technology framework can be worked out, but scaling these systems up and providing oversight is going to raise new challenges that we probably cannot anticipate. Even if two sites want to share data, they have to implement privacy protections, and depending on the kind of data being shared, technologies may not even exist to mask patient identities — biological samples are inherently problematic in this regard, but even sharing a data table is non-trivial. Apart from the privacy concerns, creating a common schema for the data to be shared sounds like an obvious thing to do, but if the two sites are using different EHR software… well, let’s say it’s not as easy as sharing PowerPoint from Mac to PC.
All in all, I came away feeling like the state of the art is both depressing and invigorating — there’s a lot to do, and I just hope that the short time frame that people go on about doesn’t result in half-baked partial solutions becoming the standard. There are a lot of questions from basic statistics through distributed system design here, so maybe after chewing on it a while I’ll get some new problem ideas.
Another cool optical illusion.
I recently visited Taos, NM, and the sky there was clear and you could see so many stars. I was listening today to Debussy’s Arabesque #1 and it brought back memories of Jack Horkheimer‘s Star Hustler (c.f. this episode from 1991). Horkheimer passed away in 2010, but his show was a PBS staple.
A series of blog posts about quantiatively assessing if America is becoming more secular : Parts one, two, and three.
Ian Hacking’s introduction to the new edition of Thomas Kuhn’s The Structure of Scientific Revolutions (via MeFi).
More reasons to miss California. I do like Chicago, but… dumplings!
CALL FOR PAPERS
IEEE Signal Processing Society
IEEE SIGNAL PROCESSING MAGAZINE
Special Issue on Signal Processing for Cyber-security and Privacy
Aims and Scope:
Information technology and electronic communications have been rapidly applied to many spheres of human activity, including commerce, medicine and social networking. This has led to the creation of massive electronic repositories for distributed information storage and processing, which enables access by a large number of authorized users. The need for timely access to electronic data makes it imperative to guarantee the security and privacy of this data. Traditionally, electronic data security has been ensured via cryptographic techniques, but these distributed data systems require security and privacy mechanisms at all levels of the system. Thus, providing precise guarantees on the security and privacy of electronic information requires leveraging a range of information processing techniques beyond traditional cryptography to ensure secure distributed storage and access mechanisms. The problems of information exchange, interaction, and access lend themselves to fundamental information processing abstractions and theoretical analysis. The tools of rate-distortion theory, distributed compression algorithms, distributed storage codes, machine learning for feature identification and suppression, and compressive sensing and sampling theory are fundamental and can be applied to precisely formulate and quantify the tradeoff between utility and privacy in a variety of domains. Thus, while rate-distortion theory and information-theoretic security can provide fundamental bounds on privacy and security leakage of distributed data systems, the information and signal processing techniques of compressive sensing, machine learning, and graphical models are the key ingredients necessary to achieve these performance limits in a variety of applications involving streaming data (smart grid, intelligent data collection), distributed data storage (cloud), and interactive data applications across a number of platforms. This special issue seeks to provide a venue for ongoing research in information and signal processing for security and privacy applications across a wide variety of domains, including communication media (e.g. ranging from wireless networks at the edge to optical backbones at the core of the Internet), to computer systems (e.g. ranging from traditional computer architectures to distributed systems, including cloud computing).
Topics of Interest include (but are not limited to):
Submission Process:
Articles submitted to this special issue must contain significant relevance to signal processing and its application to security and privacy. All submissions will be peer reviewed according to the IEEE and Signal Processing Society guidelines for both publications.Submitted articles should not have been published or under review elsewhere. Manuscripts should be submitted online using the Manuscript Central interface. Submissions to this special issue of the IEEE SIGNAL PROCESSING MAGAZINE should have significant tutorial value. Prospective authors should consult the Magazine site for guidelines and information on paper submission.
Important Dates: Expected publication date for this special issue is September 2013.
Guest Editors:
Lalitha Sankar, Lead GE, Arizona State University, USA, lalithasankar@asu.edu
Vincent H. Poor, Princeton University, USA, poor@princeton.edu
Mérouane Debbah, Supelec, Gif-sur-Yvette, France, merouane.debbah@supelec.fr
Kannan Ramchandran, University of California Berkeley, USA, kannanr@eecs.berkeley.edu
Wade Trappe, Rutgers University, USA, trappe@winlab.rutgers.edu
Somehow, I had never heard of the Arnold cat map. Meow.
I am definitely guilty of reading and walking at the same time.
Serious Eats Chicago ate all the things at Hot Doug’s, to which I have still not gone.
The Bombay Royale is an Australian band that covers 60s era Bollywood tunes. They have a new album and a video for the title track. You can also get the mp3.
PZ Myers takes Kevin Drum to task for lazy utilitarian arguments.
