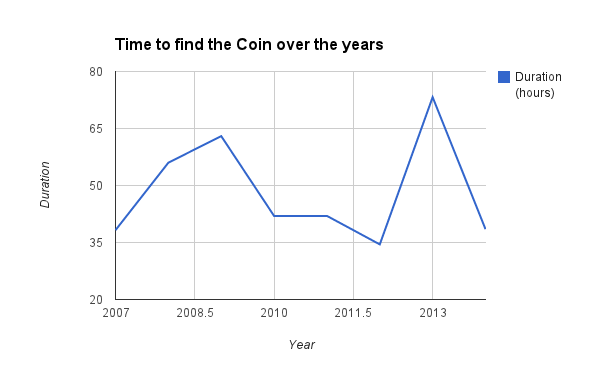
I finally snagged a few minutes to crunch some numbers from this year’s Mystery Hunt and add them into the data we have from the past few years. Firstly, the chart everyone likes to see, the hunt duration:

The spike from the epic 2013 Hunt is a bit aberrant, but overall it took less time to find the coin this year as opposed to the 2008-2009 Hunts.
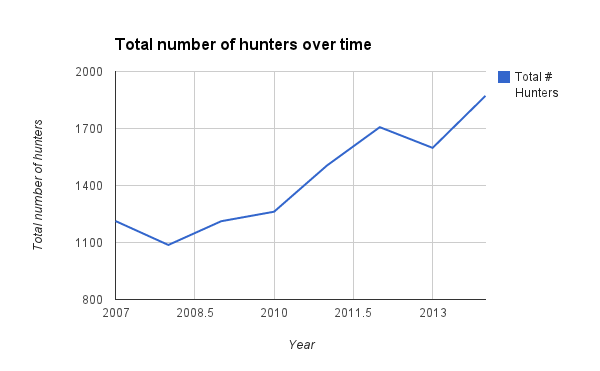
The next graph is the total number of hunters, which has been generally increasing over time:

This is somewhat alarming, since running a hunt for 2000 hunters is a significantly different challenge than running one for 1000 hunters. A number of caveats are in order. Many of these numbers are estimates, and this does not disaggregate remote from on-site solvers. Because each organizing team gathers statistics differently, the thing we can infer from this is that the Hunt has been growing over time.
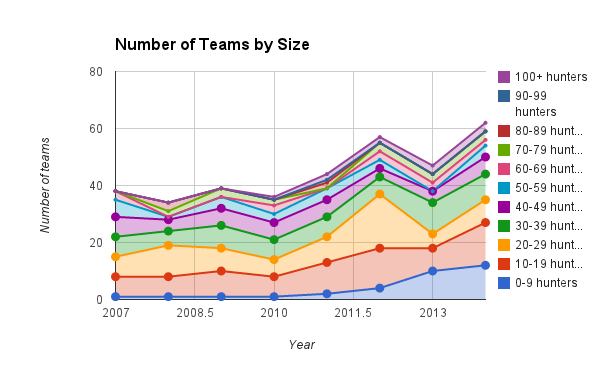
Finally, the most interesting chart (at least to me): the distribution of team sizes:

This year we had a record-breaking 62 teams register (actually more, but some dropped out — I’m looking at you, Fangorn Foureast). The growth in this chart is not because we have more mega-teams (100+ people) — there are only 3 of those, after all. The biggest change in the last 3 years is the total number of teams in the under-50 (or under-40, really) category. We have a large number of moderate-sized teams who need enough space for their HQs that they can’t do it out of their dorm rooms. This growth in the number of smaller teams is part of why adopting a design philosophy like Erin’s is important.
I’ll have to dig through the raw numbers from this year’s hunt to get more specifics about the split of this year’s hunters. As Erin pointed out, with the increase in “smaller” teams, the question is who is on these teams — mostly students? A post for another time, I imagine.