I’ve spent this week at ITA 2008 at UCSD. There have been lots of great talks, but my brain is fairly saturated, so my ability to take more than cursory notes decreased as the workshop progressed. I’ve met a number of people who apparently read this blog (hi!), which is nice. One thing I’ll try to do is put in some more links to things as I think of them and also to raise some (possibly trivial) questions that came up as I wrote about the papers.
Iterative coding for network coding
Andrea Montanari, Stanford, Vishwambar Rathi, EPFL, and Rudiger Urbanke, EPFL
I think of this paper as the Shannon-theory version of the Koetter-Kschischang coding-theory analysis of network coding. There is a preprint of some of the results on ArXiV that I read a little while ago (and unsuccessfully presented in our group meeting). The channel model is a rank metric channel (see Gabidulin), and a notion of distance between subspaces can be defined. The idea is the following — messages are encoded into subspaces of a vector space over a finite field (taken to be F2 here). The set of all subspaces is the projective space, and the set of all subspaces of dimension k is the Grassmann manifold. So we can look at a codebook as a set of binary matrices of dimension m x l. In this model, headers are preserved, so the decoder in a network code knows the transfer matrix of the channel exactly. However, errors can still be introduced in the packet payload in the following sense. Each column can be written as
yj = xj + zj
where zj is uniformly chosen from an unknown subspace of limited rank. This is a perfectly good DMC channel model, and one can calculate its capacity. The interesting thing is that then you can define an LDPC code (with all variable nodes of degree 2 and a non-soliton distribution for the check nodes) across the columns of the codeword (which is a matrix, remember), with matrix-valued weights on the edges of the Tanner graph. The messages that are propagated in the BP algorithm correspond to information about affine subspace memberships of the rows. This code (a) achieves capacity on the rank metric channel, and the error for erasures also goes to 0. Since I have been concerned about jamming and interference and malicious attacks, the assumption on the header being preserved feels like a limitation of the approach, but I think that perhaps concatenating codes may also be able to preserve something about the header information. The reason I call it sort of Shannon theoretic is that the error model is random and the density evolution arguments are a bit like the probabilistic method.
On rate-distortion function of Poisson processes with a queueing distortion measure
Todd P. Coleman, UIUC, and Negar Kiyavash, UIUC, and Vijay G. Subramanian, Hamilton Institute, NUIM
The main idea here is find a rate-distortion problem corresponding to the bits through queues result on timing channels. So given a set of Poisson arrivals {Xi}, how can we define a distortion measure and rate-distortion function that makes sense? The choice they make is to requires that the reconstruction be causal, so that the packet times in the reconstructed version are delayed w.r.t. the originals and the objective then is to minimize the induced service time of the reconstruction. This makes the test channel into a first-come first-serve queue and in particular the optimal test channel is the exponential timing channel. The rate distortion function turns out to be -a log(D) where a is the intensity of the Poisson process. The benefit of their definition is that the proofs look as clean as the AWGN and BSC rate distortion proofs.
Network tomography via network coding
G. Sharma, IIT Bombay, S. Jaggi, CUHK, and B. K. Dey IIT Bombay
Network tomography means using input-output probing of a network to infer internal structural properties. In their model, all nodes have unique IDs and share some common randomness. Inferring the presence of absence of a single edge in the graph is relatively easy, and then the process can be repeated for every edge. The more interesting problem is structural inference in an adversarial setting. They show that the graph can be recovered if the min-cut from the source to destination is greater than twice the min-cut from the adversary to the destination (I think), which squares with the Byzantine Generals problem. The tomography problem is interesting, and I wonder if one can also embed adversary-detection methods as well to create a protocol to quarantine misbehaving internal nodes.
Coding theory in projective spaces
Tuvi Etzion, Technion, and Alexander Vardy, UCSD
This talk also dealt with the rank-metric channel. Previous work of Koetter and Kscischang had found analogues to the Singleton and Johnson bounds, and here they find Delsarte, Iterated Johnson, and packing bounds, as well as a “linear programming bound.” They show there are no nontrivial perfect codes in the projective space of dimension n over Fq, and define the notion of a quasilinear code, which is an abelian group in the projective space. A code is quasilinear iff the size is a power of two. Honestly, I found myself a bit lost, since I’m not really a coding theorist, but it seems that the rank metric channel has lots of interesting properties, some of which are old, and some of which are new, and so exciting new algebraic codes can be constructed for them.
On capacity scaling in arbitrary wireless networks
Urs Niesen, MIT, Piyush Gupta, Bell Labs, and Devavrat Shah, MIT
The goal for this paper was to relax some of the random-placement assumptions made in a lot of cooperative schemes for large wireless networks. They look at n nodes scattered in [0, n1/2]2 with a standard path loss model for the gains, full CSI, and equal rate demands for the each source-destination pair. There are three schemes we can consider — multihop, hierarchical cooperation, and a new scheme they have here, cooperative multihop. For large path loss exponent the multihop strategy is optimal, and in other regimes hierarchical cooperation is optimal. The cooperative multihop scheme works by dividing the network into squarelets and then doing multihop on the squarelet-level overlay graph. This strategy is optimal in some cases, and has the benefit of not relying on the node placement model, unlike the hierarchical cooperation scheme. These network models are interesting, but the full CSI assumption seems pretty darn restrictive. I wonder if the cooperative multihop would be more attractive also because channel estimation and ranging need only be done on a local level.
Percolation processes and wireless network resilience
Zhenning Kong and Edmund M. Yeh, Yale
Consider a random geometric graph with density chosen above the percolation threshold. This is an often (ab?)used model for wireless sensor networks. First off, throwing n points in the unit square converges, in distribution to the percolation model with an infinite Poisson process in the plane and the Gilbert disc model. If we make nodes “fail” by flipping a coin for each node, this is just thinning the process, so it’s easy to find a threshold on the failure probability in terms of the percolation threshold that guarantees a giant connected component will still exist. So far so good, but what happens if the failure probability depends on the degree of the node? High degree nodes may serve more traffic and hence will fail sooner, so this is a good model. This work finds necessary and sufficient conditions on the failure probability distribution p(k) for a giant connected component to still exist. Here k is the node degree. The necessary and sufficient conditions don’t match, but they are interesting. In particular, the sufficient condition is very clean. One application of these results is to a cascading failures model, where you want to stop one node going down from taking down the whole network (c.f. power failures in August 1996). It would be interesting to see if a real load redistribution could be integrated into this — nodes have weights (load) on them, proportional to degree, say, and then dynamically nodes are killed and push their load on to their ex-neighbors. How fast does the whole network collapse? Or perhaps a sleeping-waking model where a node dumps its traffic on neighbors while sleeping and then picks up the slack when it wakes up again…
 vertices, which looks like a
  grid with the top and left edges wrapped around to connect with the bottom and right edges. Every vertex has 4 neighbors. Now imagine a very lazy random walk on this graph in which a random walker moves from vertex
  to one of its neighbors with probability
  . It’s “well known” that this random walk takes around
  steps to mix. That is, if
  is the matrix of transition probabilities then
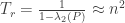
 is the second largest eigenvalue of
  is the inverse of the spectral gap of the matrix. One way of characterizing
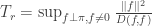
  on the states of the chain define the Dirichlet form
  by
by
 and
and  for all edges in the graph. We write
  if
if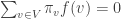
 via
via
 you should choose in the grid example to get the scaling of
  is divisible by 4 and set
  . The values for

 squares scales like
  and
and  and there are fewer than
  . Thus:
 as desired.
 but in the denominator we get
  positive terms. The key is to make all the differences
  in the denominator small while keeping the average of
  large enough. Even though you sum over
  in the numerator.
 comes from the prehistory of Gaussian processes, and probably stands for “time.” While the whole point of this book is to get away from the totally ordered structure of
  , the notation is too deeply entombed into the collective psyche of probabilists to change it now. Later on, however, when we move to manifolds as parameter spaces, we shall emphasize this by replacing
  . Nevertheless, points in
  . We hereby make the appropriate apologies to geometers.
 . You have a set of possible actions
  to choose from at each time. If you choose action
  at time
  . After you choose your action the state of nature is revealed to you. The goal is to come up with a strategy for choosing actions at each time
  .
. .
. . This strategy is called fictitious play because you are pretending to play each action over the past and choosing the one which would have given you the best performance to date. Unfortunately, the strategy is not Hannan consistent, which loosely means that the gap between the average loss under this strategy and the average loss under the best fixed action does not go to 0.
 and then choose the minimum of the noisy ones:
 .
.